Renting in Burnley
Average Rent in Burnley
Rent in Burnley before the rush.
The average rent in Burnley is £675/mo, with 1,439 live listings across 5 portals from £400/mo. Compare rents by bedroom and area below — and get alerted the moment a new Burnley rental appears.
7 days free · card on sign-up · cancel anytime
Fresh alerts, first
We email you the moment a matching rental lands in Burnley.
Set it, leave it
Pick budget, bedrooms, areas of Burnley — we remember the rest.
Down to the postcode
Narrow to one corner of Burnley or watch the whole city.
Live from the portals
Latest rentals in Burnley
The freshest listings we picked up across Rightmove, OnTheMarket, OpenRent, PrimeLocation, SpareRoom and Leaders.
 £900/moPrimeLocation
2 bed property
Sixth Avenue, Bolton BL3
2View listing £625/moPrimeLocation
2 bed property
Briercliffe Road, Burnley BB10
2View listing £550/moPrimeLocation
2 bed property
Leyland Road, Burnley BB11
2View listing £525/moPrimeLocation
1 bed property
Coal Clough Lane, Burnley BB11
1View listing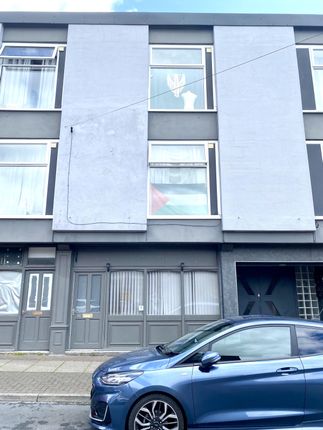 £450/moPrimeLocation
1 bed property
Ormerod Street, Burnley BB11
1View listing £595/moPrimeLocation
2 bed property
36 Willow Street, Accrington BB5
2View listing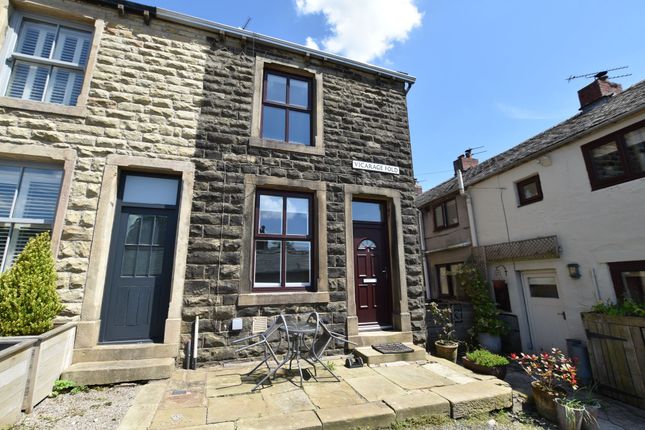 £850/moPrimeLocation
2 bed property
Vicarage Fold, Wiswell BB7
2View listing £500/moPrimeLocation
1 bed property
Stevenson Street East, Accrington BB5
1View listing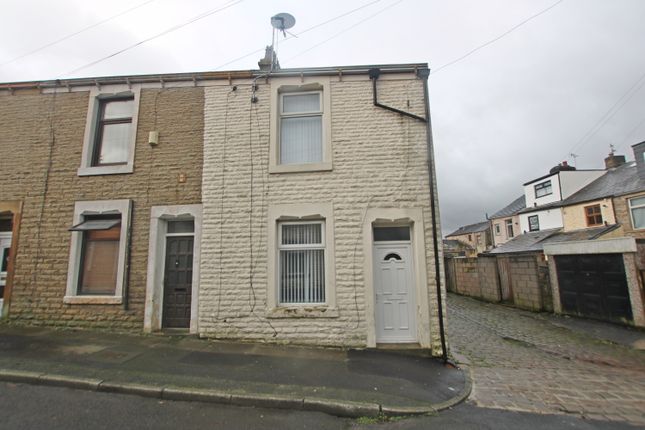 £575/moPrimeLocation
2 bed property
Milton Street, Oswaldtwistle, Accrington BB5
2View listing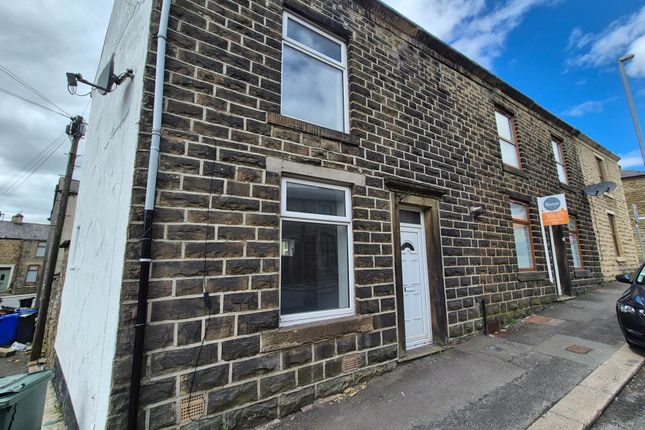 £625/moPrimeLocation
1 bed property
Bury Road, Rossendale, Haslingden BB4
1View listing £825/moPrimeLocation
2 bed property
Bury Road, Rawtenstall BB4
2View listing £1,400/moPrimeLocation
3 bed property
Whalley Road, Langho BB6
3View listing £575/moPrimeLocation
1 bed property
Mosley Street, Blackburn BB2
1View listing £850/moPrimeLocation
2 bed property
Columbia Way, Blackburn BB2
2View listing £550/moPrimeLocation
1 bed property
Savile Park Road, Halifax HX1
1View listing £1,000/moPrimeLocation
3 bed property
Brier St, Halifax HX3
3View listing £925/moPrimeLocation
1 bed property
Apartment 39, 7 Cotton Gardens, Bolton BL1
1View listing £550/moPrimeLocation
1 bed property
Station Road, Sowerby Bridge HX6
1View listing £1,150/moPrimeLocation
3 bed property
Tansy Road, Whittingham, Preston PR3
3View listing £650/moPrimeLocation
1 bed property
Goose Eye, Keighley, West Yorkshire BD22
1View listing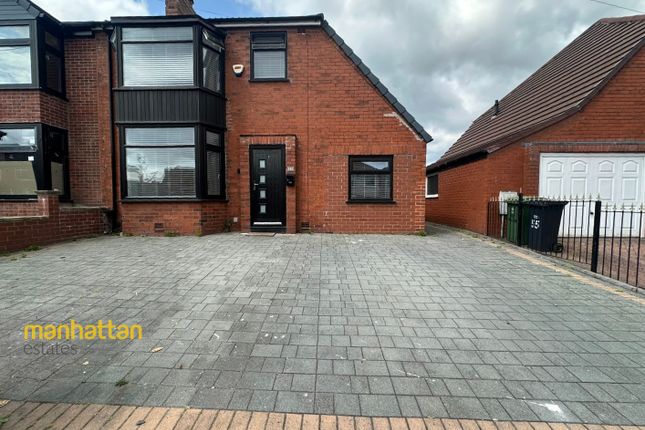 £1,300/moPrimeLocation
3 bed property
Hill Cot Road, Sharples, Bolton BL1
3View listing £695/moPrimeLocation
2 bed property
Montague Street, Blackburn BB2
2View listing £500/moPrimeLocation
1 bed property
Low Street, Keighley BD21
1View listing £1,950/moPrimeLocation
3 bed property
Highfield Lane, Keighley BD21
3View listing
Listings refresh as our scraper picks up new properties for Burnley. Click through to the source portal to enquire.
Renting in Burnley
What it costs to rent in Burnley
Burnley currently has 1,439 rental properties listed across the portals we track, with a median rent of £675 a month. 65 new homes appeared in the past week alone. Among the houses and flats listed, roughly 72% are houses and the rest are flats.
Rents vary sharply by postcode. The most affordable outcode we track is BB11 at around £600/mo, while BL7 sits nearer £1,150/mo. For a wider view of where the UK’s cheapest rents are, see our guide to the cheapest cities to rent in the UK.
Dwellio watches Rightmove, OnTheMarket, OpenRent, PrimeLocation, SpareRoom and Leaders for Burnley around the clock — so a new listing reaches your inbox before most renters have refreshed the app. Here’s how our rental alerts work. Looking further afield? You can browse rentals in every UK city.
How it works
Your first Burnley alert in under a minute
Four steps between you and never missing a good one in Burnley.
Tell us where home is
Pop in your budget, bed count and favourite corners of Burnley. A minute, tops.
We'll watch the portals
Six major sites, checked every couple of minutes. Yes, on Sundays too.
Alert lands in your inbox
The moment a match appears, email arrives before most people open the app.
Market snapshot
Burnley rental market at a glance
Active rentals in Burnley
Median monthly rent
Property sites we watch
Rental prices
Rent by bedrooms in Burnley
Median monthly rent, based on 1,439 active listings across 5 property sites.
| Bedrooms | Median rent | Available |
|---|---|---|
| 1 bed | £520/mo | 327 |
| 2 bed | £650/mo | 652 |
| 3 bed | £875/mo | 317 |
| 4+ bed | £1,395/mo | 76 |
| Room | £463/mo | 60 |
Updated July 2026. Prices normalised to monthly where weekly was listed.
Free monthly digest
Watch Burnley rents without checking every week
One email a month: what the median rent did, which postcodes moved, and how much came to market. Built from live listings across six UK property sites. No card, no account, unsubscribe anytime.
We’ll email you once to confirm. See our privacy policy.
Rent trend · ONS PIPR
How Burnley rents have moved
Office for National Statistics Price Index of Private Rents — official monthly average rent across all tenures in Burnley. Latest: £624/mo (Mar 26, +4.9% YoY).
Latest
£624
Mar 26
Annual
+4.9%
vs last year
5-yr ago
£476
Apr 21
Total change
+31%
since 2021
Source: Office for National Statistics · Price Index of Private Rents (PIPR). Updated monthly with a ~2-month lag. ONS uses Broad Rental Market Areas in Scotland — figures may aggregate beyond the city itself.
Affordability · ONS ASHE
What share of Burnley pay goes on rent?
Renters in Burnley spend an estimated 25% of the local median gross salary on rent — based on the ONS Price Index of Private Rents and ASHE Table 8 (2025).
Median rent
£624/mo
£7,488/yr
Median pay
£29,680/yr
gross, ASHE 2025
Rent burden
25%
Very affordable — well below the 30% rent-burden threshold.
Sources: Office for National Statistics — Price Index of Private Rents (latest month) and Annual Survey of Hours and Earnings Table 8.7a (median annual gross pay, place of residence). The 30% line is the conventional rent-burden threshold above which housing costs are considered to crowd out other essentials.
Council tax · VOA 2024
Council tax bands across Burnley
Most Burnley homes sit in Band A. The weighted average works out close to Band A–B across 42,890 properties on the council-tax list.
Modal band
A
most common band
Mean band
1.83
≈ Band A–B
Stock
43k
42,890 properties
- A60%25,770
- B14%5,820
- C15%6,460
- D7%3,040
- E3%1,310
- F1%340
- G0%130
- H0%20
Source: HM Valuation Office Agency — Council Tax Stock of Properties (CTSOP1.0), extract dated 31 March 2024. Covers England and Wales; Scotland and Northern Ireland use separate band schemes and aren't included.
Broadband · Ofcom Connected Nations
Broadband coverage across Burnley
89% of Burnley premises can already get full-fibre and 96% can get gigabit speeds — Ofcom Connected Nations residential coverage, July 2025.
Full fibre
89%
FTTP-ready premises
Gigabit
96%
≥1Gbit/s available
Superfast
99%
≥30Mbit/s available
Mean speed
485 Mbit/s
bucket-weighted estimate
- Full fibre (FTTP)89%
- Gigabit-capable96%
- Superfast (≥30 Mbit/s)99%
Source: Ofcom Connected Nations residential coverage by Local Authority (Burnley), July 2025, covering 42,690 premises. Mean download speed is estimated from Ofcom speed-bucket midpoints.
Energy efficiency · DESNZ EPC
EPC ratings for Burnley homes
32% of Burnley homes hold a current EPC in bands A–C — the bands that meet the proposed 2030 minimum energy-efficiency standard for rented stock.
Bands A–C
32%
good energy-efficiency stock
Bands D–G
68%
below the proposed 2030 floor
Certificates
44k
43,582 EPCs
- A0%159
- B6%2,684
- C26%11,242
- D43%18,642
- E19%8,086
- F5%2,000
- G2%769
Source: DESNZ Energy Performance of Buildings register (replacement for opendatacommunities.org), domestic certificates filed under Burnley. Covers England and Wales — Scottish EPCs are held in a separate Scottish register and aren't included.
Schools · GIAS · DfE
State-funded schools near Burnley
17 open state-funded schools sit within one mile of the Burnley centroid. The five closest:
- 10.34 mi
Burnley St Peter's Church of England Primary School
Primary · Voluntary aided school · BB11 2DL
- 20.47 mi
Burnley Springfield Community Primary School
Primary · Community school · BB11 3HP
- 30.49 mi
Burnley Holy Trinity Church of England Primary School
Primary · Voluntary aided school · BB11 4LB
- 40.62 mi
Coal Clough Academy
Not applicable · Academy alternative provision sponsor led · BB11 4PF
- 50.65 mi
St Mary's RC Primary School, a Voluntary Academy
Primary · Academy converter · BB10 4BH
Source: DfE Get Information About Schools (state-funded extract). Distances are straight-line from each school's postcode to the Burnley centroid. Ofsted ratings were removed from GIAS in January 2025 and aren't available here.
Property types
What’s on offer in Burnley
Flats & apartments
23126% of listings
Houses
58267% of listings
Rooms
607% of listings
Bungalows
10% of listings
Property mix · houses
Houses to rent in Burnley — what's on the market
Terraced houses make up 81% of the 583 houses currently advertised in Burnley.
- Terraced81%474
- Other house10%58
- Semi-detached8%44
- Detached1%6
- Bungalow0%1
Rent by postcode
Where Burnley rent is highest and lowest
Median monthly rent grouped by outcode across 1,067 live listings in 22 outcodes. Outcodes with fewer than 3 listings are skipped to avoid skew from a single luxury rental.
Most expensive in Burnley
- 1BL7£1,150/mo7 rentals
- 2BB18£1,150/mo7 rentals
- 3OL11£1,130/mo7 rentals
Cheapest in Burnley
- 1BB11£600/mo314 rentals
- 2BB9£638/mo50 rentals
- 3BB10£663/mo278 rentals
Features · Burnley
Garden, parking, and floor area in Burnley
Live signal across 1,439 Burnley rentals scraped from six UK portals. Coverage varies by portal — figures below show the share of listings whose advertiser surfaces the feature.
Garden
69%
of 158 Burnley listings advertise a garden, patio, or terrace.
Parking
71%
of 205 Burnley listings include parking, a driveway, or a garage.
Area safety
Safety in Burnley
Lower Crime AreaBased on the latest police data (July 2026), Burnley has a lower crime rate compared to other UK cities. Across 31 of 31 postcode districts analysed, the median was 76 reported crimes per area. The most common category in Burnley is Anti-social behaviour, accounting for 0% of all incidents.
Crime overview
- 76 crimes per area (median)
- 31 of 31 postcode districts covered
- Data: July 2026
Most reported
- Anti-social behaviour
- 0% of incidents
Burnley ranks well for renters concerned about neighbourhood safety. Every Dwellio alert includes the area’s crime data so you can compare at a glance.
Data from data.police.uk, updated monthly. Contains public-sector information licensed under OGL v3.0.
Area breakdown
Safety by suburb in Burnley
Street-level crime counts from data.police.uk for May 2026, covering a ~1 mile radius around each suburb centre. Figures are normalised per 1,000 residents so you can compare neighbourhoods fairly.
Padiham
Safer areaMost common: Violent crime (71) · pop. ~10,000
15per 1kBrunshaw
Typical for cityMost common: Violent crime (176) · pop. ~6,000
83per 1kRosehill
Typical for cityMost common: Violent crime (193) · pop. ~7,000
75per 1kBurnley Wood
Typical for cityMost common: Violent crime (207) · pop. ~6,000
96per 1kWhittlefield
Typical for cityMost common: Violent crime (169) · pop. ~5,000
90per 1k
Suburbs shown are representative populated areas; figures reflect street-level incidents within ~1 mile of each centre. Data from data.police.uk. Contains public-sector information licensed under OGL v3.0.
Where we search
Burnley listings by portal
We watch 5 property sites for rentals in Burnley.
Start getting alerts
Try Dwellio free for 7 days
We’ll email the moment a matching rental goes live in Burnley.
Dwellio
Alerts that land before the rush.
- Up to 10 search areas
- Alerts within 15 minutes of listing
- Unlimited email alerts
- Price-drop alerts
- Back-on-market alerts
- "Days on market" badge
- Priority support from a human
Frequently asked
Renting in Burnley — your questions answered
What is the average rent in Burnley?
The median rent in Burnley is £675/month based on 1439 active listings across 5 property portals (2026-07).
How many rental properties are available in Burnley?
There are currently 1439 rental properties available in Burnley, with 65 new listings added in the last 7 days.
Is Burnley safe for renters?
Burnley has a lower crime rate compared to other UK cities, with a median of 76 reported crimes per postcode area (July 2026). The most common category is Anti-social behaviour. Data from data.police.uk.
What is the most common crime in Burnley?
The most commonly reported crime category in Burnley is Anti-social behaviour, based on data.police.uk records for July 2026.
Cities to rent in nearby
Areas to rent near Burnley
More places renters search alongside Burnley. We monitor every UK portal in each city — set alerts for as many as you like.
Average rent in Crewe
Median rents, area data & live alerts
Average rent in Carlisle
Median rents, area data & live alerts
Average rent in Lancaster
Median rents, area data & live alerts
Average rent in Chester
Median rents, area data & live alerts
Average rent in Preston
Median rents, area data & live alerts
Average rent in Rochdale
Median rents, area data & live alerts
Average rent in Oldham
Median rents, area data & live alerts
Average rent in Blackburn
Median rents, area data & live alerts
Average rent in Salford
Median rents, area data & live alerts
Compare across the UK
Average rent in major UK cities
See how Burnley compares with the UK’s largest rental markets — median rents, area data and live alerts for each.
Renting guides
Search smarter than the Burnley crowd
Guides on covering every portal and reaching new Burnley listings first.
Best property alert tools in the UK
How the main rental-alert services compare on speed and portal coverage.
Read guideBest alternatives to Rightmove
The UK portals worth searching beyond Rightmove — and what each one adds.
Read guideRightmove vs Zoopla vs OnTheMarket
What each portal covers, where the gaps are, and how to stop missing listings.
Read guide
Start getting Burnley alerts today
7 days free. Card on sign-up. Cancel anytime.
Start free trial- 7 days free
- Card on sign-up
- Cancel anytime
- Setup in 60 seconds