Average studio rent in Brighton
£990/mo
The median asking rent for a studio in Brighton is £990 a month, 38% below the city-wide median of £1,595, based on 710 studios currently on the market.
Renting in Brighton
Rent in Brighton before the rush.
Median asking rent across 8,656 live Brighton listings on 5 portals from £400/mo, broken down by property size below — plus how rents have moved, where they are highest and lowest, and what landed on the market this week.
Median asking rent
£1,595 /month
8,656 live listings · 5 portals
| Size | Median rent | Listings |
|---|---|---|
| Studio | £990/mo | 710 |
| 1 bed | £1,150/mo | 2,361 |
| 2 bed | £1,695/mo | 1,810 |
| 3 bed | £2,100/mo | 785 |
| 4+ bed | £2,773/mo | 1,942 |
| Room (house share) | £700/mo | 1,048 |
Asking rents from live listings on Rightmove, OnTheMarket, OpenRent, PrimeLocation, SpareRoom and Leaders · Updated . Weekly prices normalised to monthly.
Free to sign up · no card needed · upgrade when you’re ready
Renting in Brighton
Brighton currently has 8,656 rental properties listed across the portals we track, with a median rent of £1,595 a month. 349 new homes appeared in the past week alone. Among the houses and flats listed, roughly 36% are houses and the rest are flats.
Rents vary sharply by postcode. The most affordable outcode we track is BN21 at around £1,150/mo, while BN52 sits nearer £2,395/mo. For a wider view of where the UK’s cheapest rents are, see our guide to the cheapest cities to rent in the UK.
Dwellio watches Rightmove, OnTheMarket, OpenRent, PrimeLocation, SpareRoom and Leaders for Brighton around the clock — so a new listing reaches your inbox before most renters have refreshed the app. Here’s how our rental alerts work. Looking further afield? You can browse rentals in every UK city.
Rent by property size
Median monthly asking rent for each property size, from 8,656 live listings across 5 property sites (September 2026).
£990/mo
The median asking rent for a studio in Brighton is £990 a month, 38% below the city-wide median of £1,595, based on 710 studios currently on the market.
£1,150/mo
The median asking rent for a 1-bed home in Brighton is £1,150 a month, 28% below the city-wide median of £1,595, based on 2,361 listings currently on the market.
£1,695/mo
The median asking rent for a 2-bed home in Brighton is £1,695 a month, 6% above the city-wide median of £1,595, based on 1,810 listings currently on the market.
£2,100/mo
The median asking rent for a 3-bed home in Brighton is £2,100 a month, 32% above the city-wide median of £1,595, based on 785 listings currently on the market.
£2,773/mo
The median asking rent for a four-bedroom-plus home in Brighton is £2,773 a month, 74% above the city-wide median of £1,595, based on 1,942 listings currently on the market.
£700/mo
The median asking rent for a room in a Brighton house share is £700 a month, 56% below the city-wide median of £1,595, based on 1,048 rooms currently listed, mostly on SpareRoom and OpenRent.
Medians exclude prices that fail our junk-listing floor. Room rents are per room, not per property.
Free monthly digest
One email a month: what the median rent did, which postcodes moved, and how much came to market. Built from live listings across six UK property sites. No card, no account, unsubscribe anytime.
We’ll email you once to confirm. See our privacy policy.
Rent trend · ONS PIPR
Office for National Statistics Price Index of Private Rents — official monthly average rent across all tenures in Brighton. Latest: £1,809/mo (Jul 26, -1.1% YoY).
Latest
£1,809
Jul 26
Annual
-1.1%
vs last year
5-yr ago
£1,433
Aug 21
Total change
+26%
since 2021
Source: Office for National Statistics · Price Index of Private Rents (PIPR). Updated monthly with a ~2-month lag. ONS uses Broad Rental Market Areas in Scotland — figures may aggregate beyond the city itself.
Affordability · ONS ASHE
Renters in Brighton spend an estimated 65% of the local median gross salary on rent — based on the ONS Price Index of Private Rents and ASHE Table 8 (2025).
Median rent
£1,809/mo
£21,708/yr
Median pay
£33,506/yr
gross, ASHE 2025
Rent burden
65%
Severely stretched — most local renters need a flatmate or supplement income.
Sources: Office for National Statistics — Price Index of Private Rents (latest month) and Annual Survey of Hours and Earnings Table 8.7a (median annual gross pay, place of residence). The 30% line is the conventional rent-burden threshold above which housing costs are considered to crowd out other essentials.
Property types
55% of listings
30% of listings
14% of listings
0% of listings
Property mix · houses
Terraced houses make up 49% of the 2,300 houses currently advertised in Brighton.
Rent by postcode
Median monthly rent grouped by outcode across 5,331 live listings in 10 outcodes. Outcodes with fewer than 3 listings are skipped to avoid skew from a single luxury rental.
Features · Brighton
Live signal across 8,656 Brighton rentals scraped from six UK portals. Coverage varies by portal — figures below show the share of listings whose advertiser surfaces the feature.
Garden
70%
of 1,995 Brighton listings advertise a garden, patio, or terrace.
Parking
58%
of 1,808 Brighton listings include parking, a driveway, or a garage.
Floor area · £/sqft
£2.42 /sqft
Median 818 sqft across 953 Brighton listings that publish floor area.
Live from the portals
349 homes came onto the Brighton rental market in the last 7 days across Rightmove, OnTheMarket, OpenRent, PrimeLocation, SpareRoom and Leaders. The freshest are below.
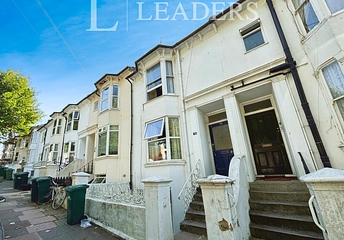
1 bed flat/apartment
Franklin Road, Brighton, BN2
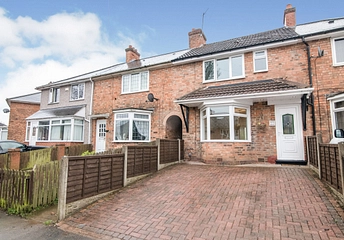
3 bed house
Greenaleigh Road, Birmingham, B14
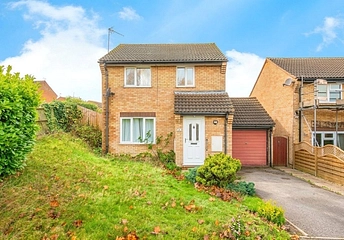
3 bed house
Lidgate Court, Felixstowe, Suffolk, IP11
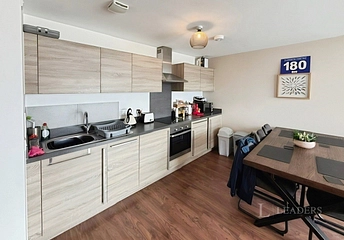
2 bed flat/apartment
The Riley Building, Derwent Street, Salford, M5
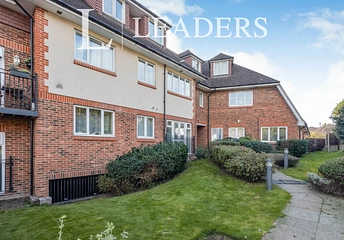
2 bed flat/apartment
Brook Road, Redhill, RH1
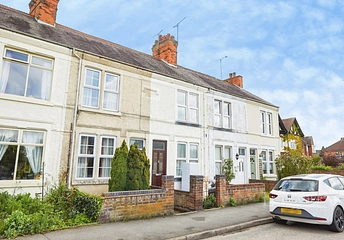
2 bed house
Cossington Road, Sileby, Loughborough, LE12
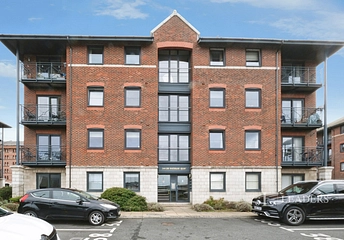
2 bed flat/apartment
Waterloo Road, Liverpool, Merseyside, L3
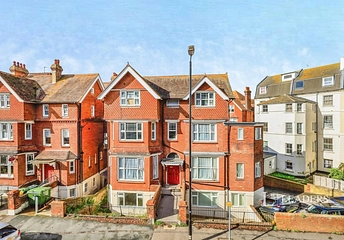
2 bed flat/apartment
Compton House, 24 Compton Street, Eastbourne, BN21
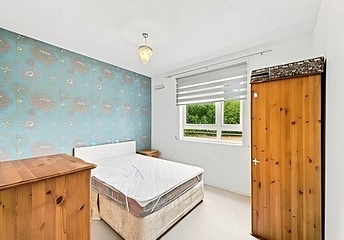
2 bed flat/apartment
West Cotton Close, Northampton, Northamptonshire, NN4
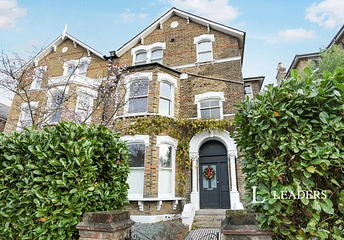
2 bed flat/apartment
Tyrwhitt Road, London, SE4
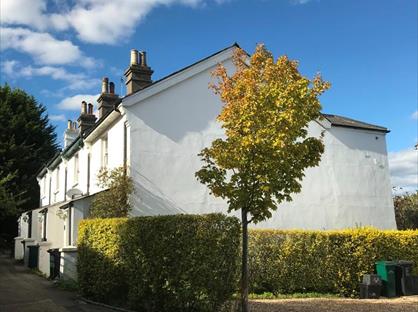
2 bed cottage
2 Bed Terraced House, Waterworks Cottages, BN3
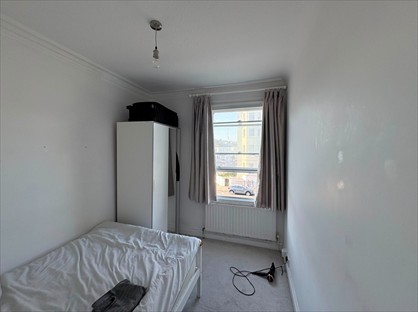
3 bed room
Room in a Shared Flat, Victoria Terrace, BN3
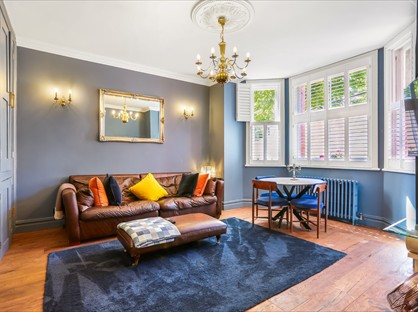
1 bed flat/apartment
1 Bed Flat, The Drive, BN3
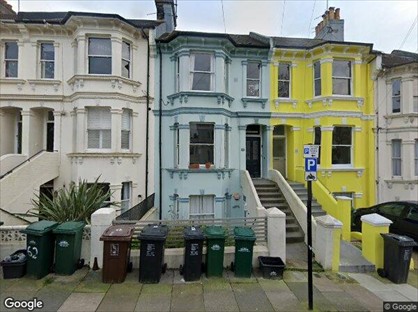
2 bed flat/apartment
2 Bed Flat, Springfield Road, BN1
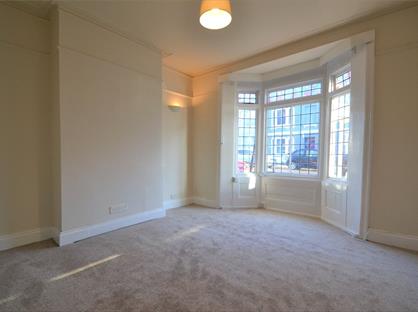
1 bed flat/apartment
1 Bed Flat, Beaconsfield Road, BN1
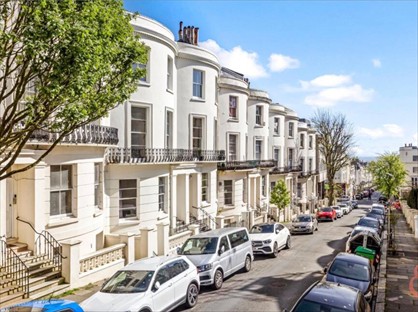
4 bed terraced house
4 Bed Terraced House, Brunswick Road, BN3
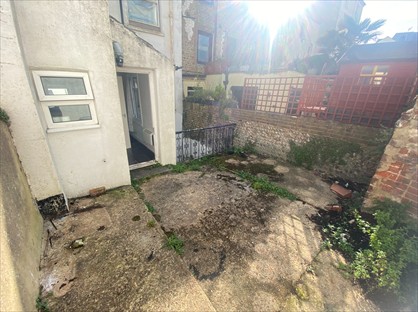
1 bed flat/apartment
1 Bed Flat, Russell Square, BN1
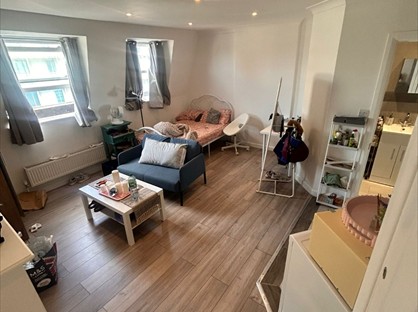
1 bed flat/apartment
Studio Flat, West Street, BN1
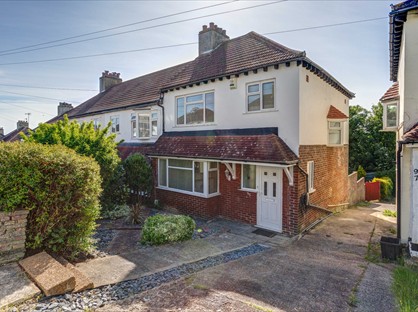
3 bed semi-detached house
3 Bed Semi-Detached House, Bevendean Crescent, BN2
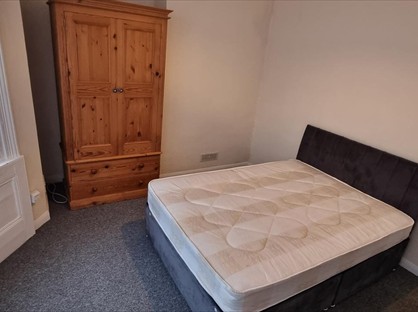
4 bed room
Room in a Shared Flat, Westbourne Gardens, BN3
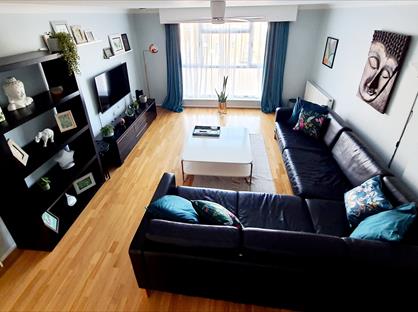
3 bed terraced house
3 Bed Terraced House, Goldstone Lane, BN3
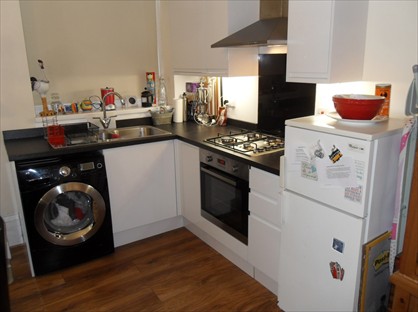
1 bed flat/apartment
Studio Flat, Clarendon Villas, BN3
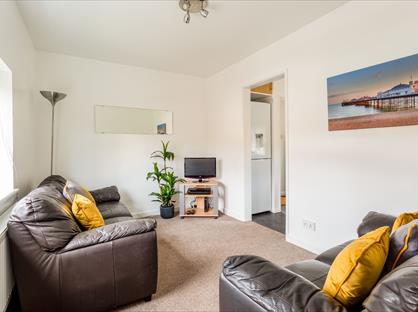
5 bed room
Room in a Shared House, Southall Avenue, BN2
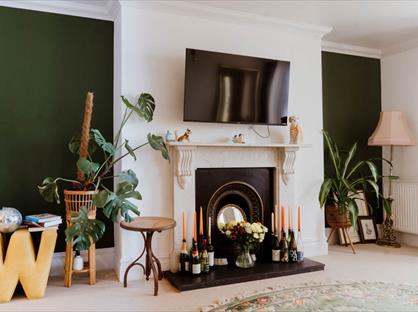
2 bed flat/apartment
2 Bed Flat, St Aubyns Gardens, BN3
Listings refresh as our scraper picks up new properties for Brighton. Click through to the source portal to enquire.
How it works
Four steps between you and never missing a good one in Brighton.
Pop in your budget, bed count and favourite corners of Brighton. A minute, tops.
Six major sites, checked every couple of minutes. Yes, on Sundays too.
The moment a match appears, email arrives before most people open the app.
Council tax · VOA 2024
Most Brighton homes sit in Band C. The weighted average works out close to Band B–C across 135,160 properties on the council-tax list.
Modal band
C
most common band
Mean band
2.85
≈ Band B–C
Stock
135k
135,160 properties
Source: HM Valuation Office Agency — Council Tax Stock of Properties (CTSOP1.0), extract dated 31 March 2024. Covers England and Wales; Scotland and Northern Ireland use separate band schemes and aren't included.
Broadband · Ofcom Connected Nations
59% of Brighton premises can already get full-fibre and 85% can get gigabit speeds — Ofcom Connected Nations residential coverage, July 2025.
Full fibre
59%
FTTP-ready premises
Gigabit
85%
≥1Gbit/s available
Superfast
98%
≥30Mbit/s available
Mean speed
458 Mbit/s
bucket-weighted estimate
Source: Ofcom Connected Nations residential coverage by Local Authority (Brighton and Hove), July 2025, covering 135,239 premises. Mean download speed is estimated from Ofcom speed-bucket midpoints.
Energy efficiency · DESNZ EPC
45% of Brighton homes hold a current EPC in bands A–C — the bands that meet the proposed 2030 minimum energy-efficiency standard for rented stock.
Bands A–C
45%
good energy-efficiency stock
Bands D–G
55%
below the proposed 2030 floor
Certificates
124k
124,469 EPCs
Source: DESNZ Energy Performance of Buildings register (replacement for opendatacommunities.org), domestic certificates filed under Brighton and Hove. Covers England and Wales — Scottish EPCs are held in a separate Scottish register and aren't included.
Schools · GIAS · DfE
11 open state-funded schools sit within one mile of the Brighton centroid. The five closest:
Middle Street Primary School
Primary · Community school · BN1 1AL
Carlton Hill Primary School
Primary · Community school · BN2 9HS
Tarnerland Nursery School
Nursery · Local authority nursery school · BN2 0GR
St Paul's CofE Primary School
Primary · Voluntary aided school · BN1 3LP
Royal Spa Nursery School
Nursery · Local authority nursery school · BN2 0BT
Source: DfE Get Information About Schools (state-funded extract). Distances are straight-line from each school's postcode to the Brighton centroid. Ofsted ratings were removed from GIAS in January 2025 and aren't available here.
Area safety
Based on the latest police data (September 2026), Brighton has a lower crime rate compared to other UK cities. Across 22 of 22 postcode districts analysed, the median was 45 reported crimes per area. The most common category in Brighton is Violent crime, accounting for 24% of all incidents.
Brighton ranks well for renters concerned about neighbourhood safety. Every Dwellio alert includes the area’s crime data so you can compare at a glance.
Data from data.police.uk, updated monthly. Contains public-sector information licensed under OGL v3.0.
Area breakdown
Street-level crime counts from data.police.uk for July 2026, covering a ~1 mile radius around each suburb centre. Figures are normalised per 1,000 residents so you can compare neighbourhoods fairly.
Most common: Anti-social behaviour (211) · pop. ~92,000
Most common: Violent crime (418) · pop. ~14,000
Most common: Violent crime (87) · pop. ~10,000
Most common: Violent crime (536) · pop. ~9,000
Most common: Anti-social behaviour (38) · pop. ~18,000
Suburbs shown are representative populated areas; figures reflect street-level incidents within ~1 mile of each centre. Data from data.police.uk. Contains public-sector information licensed under OGL v3.0.
Where we search
We watch 5 property sites for rentals in Brighton.
Start getting alerts
Free to sign up — no card needed. We’ll email the moment a matching rental goes live in Brighton.
Dwellio
Alerts that land before the rush.
Frequently asked
The average (median) asking rent in Brighton is £1,595 a month — a 1-bed is £1,150 and a 2-bed £1,695, based on 8,656 live listings across 5 property portals in Sept 2026.
The median asking rent for a studio in Brighton is £990 a month, 38% below the city-wide median of £1,595, based on 710 studios currently on the market.
The median asking rent for a 1-bed home in Brighton is £1,150 a month, 28% below the city-wide median of £1,595, based on 2,361 listings currently on the market.
The median asking rent for a 2-bed home in Brighton is £1,695 a month, 6% above the city-wide median of £1,595, based on 1,810 listings currently on the market.
The median asking rent for a 3-bed home in Brighton is £2,100 a month, 32% above the city-wide median of £1,595, based on 785 listings currently on the market.
The median asking rent for a four-bedroom-plus home in Brighton is £2,773 a month, 74% above the city-wide median of £1,595, based on 1,942 listings currently on the market.
The median asking rent for a room in a Brighton house share is £700 a month, 56% below the city-wide median of £1,595, based on 1,048 rooms currently listed, mostly on SpareRoom and OpenRent.
There are currently 8,656 rental properties available in Brighton, with 349 new listings added in the last 7 days.
Brighton has a lower crime rate compared to other UK cities, with a median of 45 reported crimes per postcode area (September 2026). The most common category is Violent crime. Data from data.police.uk.
The most commonly reported crime category in Brighton is Violent crime, based on data.police.uk records for September 2026.
Across South East
How Brighton compares with the other 34 places we track in South East — median asking rent from live listings, updated September 2026.
Every city, every region, one table: the UK rental index.
Compare across the UK
See how Brighton compares with the UK’s largest rental markets — median rents, area data and live alerts for each.
Renting guides
Guides on covering every portal and reaching new Brighton listings first.
Best property alert tools in the UK
How the main rental-alert services compare on speed and portal coverage.
Read guideBest alternatives to Rightmove
The UK portals worth searching beyond Rightmove — and what each one adds.
Read guideRightmove vs Zoopla vs OnTheMarket
What each portal covers, where the gaps are, and how to stop missing listings.
Read guideFree to sign up. No card needed. Cancel anytime.
Start free